The election created a sense of anxiety and uncertainty among many people for a variety of reasons. One such concern was around how the election would affect business value. Elections often lead to changes in consumer behavior, new regulations, and changes in existing policies, directly affecting business operations and value. Furthermore, elections influence market conditions and the economy, impacting factors such as interest rates, tax policies, and government spending, which in turn affect the cost of capital and the overall business environment. With the election uncertainty now behind us, we can now start making more informed decisions. The increased certainty in the political landscape allows us to better assess geopolitical risks and their implications on business value.
In our ESOP sector, we continue to perform annual valuations to assist employee-owned companies with share repurchases upon employee retirement. We saw a pickup in that activity in the third quarter, as not all of our ESOP clients have a calendar year valuation date. We are actively preparing for our “ESOP season” as we approach the end of the calendar-year.
Meanwhile, other members of the valuation team have been focusing on assisting business owners with exit planning through their value acceleration service. Recently, Casey Karlsen from our valuation team presented about this topic at the Maine Tax Forum, highlighting its growing interest. The value acceleration exit planning framework is designed to help business owners identify and address value constraints and transferability limitations, but like turning a ship, it takes time. We recommend that business owners understand their strengths, limitations, and value at least five years before planning to exit. This proactive approach allows for a smoother transition and maximizes the business’s value.

We track trends in several databases of private company transactions, among them GF Data, Capital IQ, DealStats, and BIZCOMPS. As presented below, we saw a slight downturn in multiples in the third quarter of 2024. We also saw the number of transactions decrease slightly in the third quarter compared to the first and second quarters of 2024.
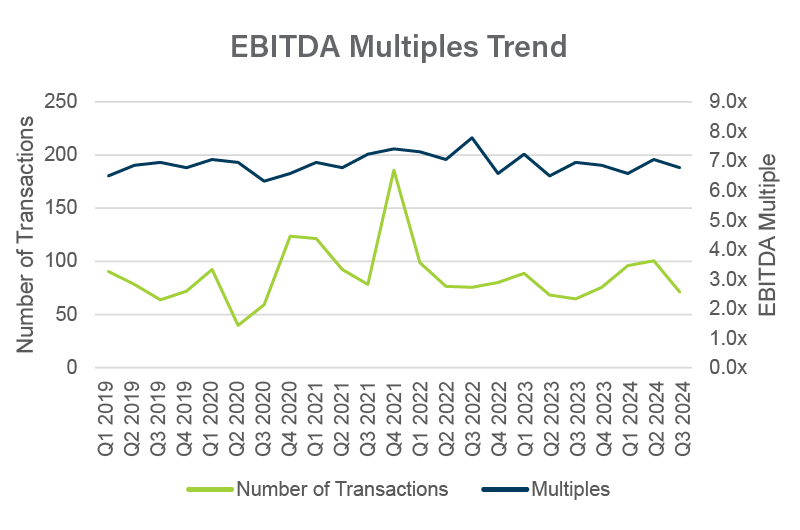
Don’t get too fixated on the multiples in this chart as an indicator of value for your company. Look at the trends. Multiples vary dramatically from industry to industry and business to business. If you are interested in exploring value drivers for your company, read this recent article.

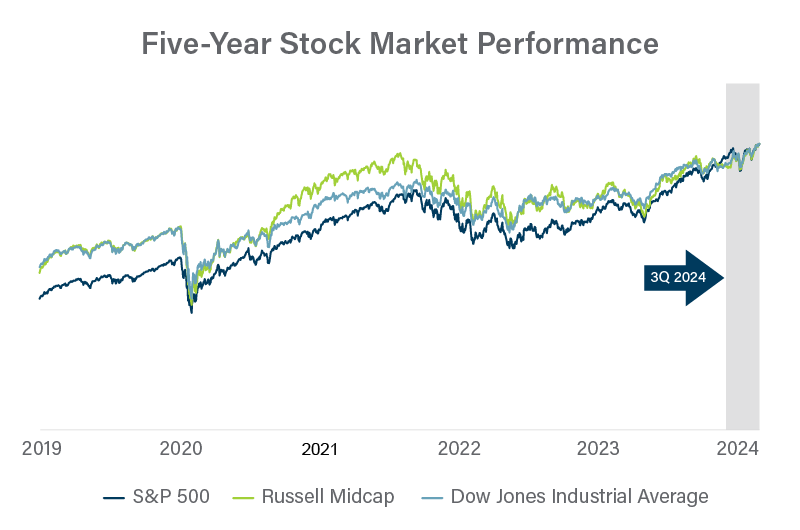
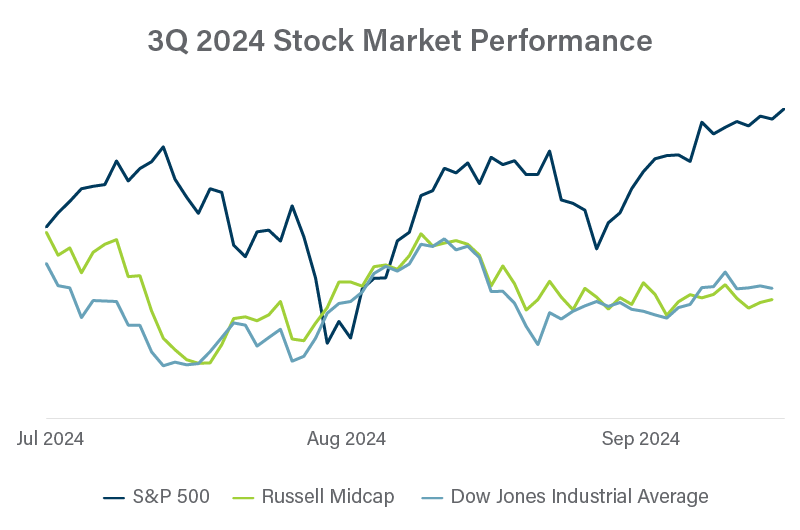
The value of privately held companies often isn’t as volatile as share prices for public companies. However, activity in the stock market provides general guidance that is often much more timely than data available for private companies.
There are a few indexes we keep an eye on. The S&P 500 is generally considered the go-to benchmark for stock market performance, although it is dominated by a handful of large tech stocks. The Russell Midcap Index cuts out the largest 200 companies in the Russell 1000 Index, keeping 800 US companies with market capitalizations between $2 billion and $10 billion. The Dow Jones Industrial Average is comprised of 30 “blue chip” US stocks that may be similar to many private companies.
Stock prices have followed a generally upward trend throughout the first three quarters of 2024.

Many drivers of business value can be influenced or controlled by the decisions of the business’s management team, including product diversification, brand recognition, and employee retention. Other drivers are outside of management’s control, such as inflation and unemployment rates. As summarized below, key drivers of the US economy generally remained near similar levels in 3Q as in 2Q.1
1 Source: Federal Reserve Economic Data, available at https://fred.stlouisfed.org/.
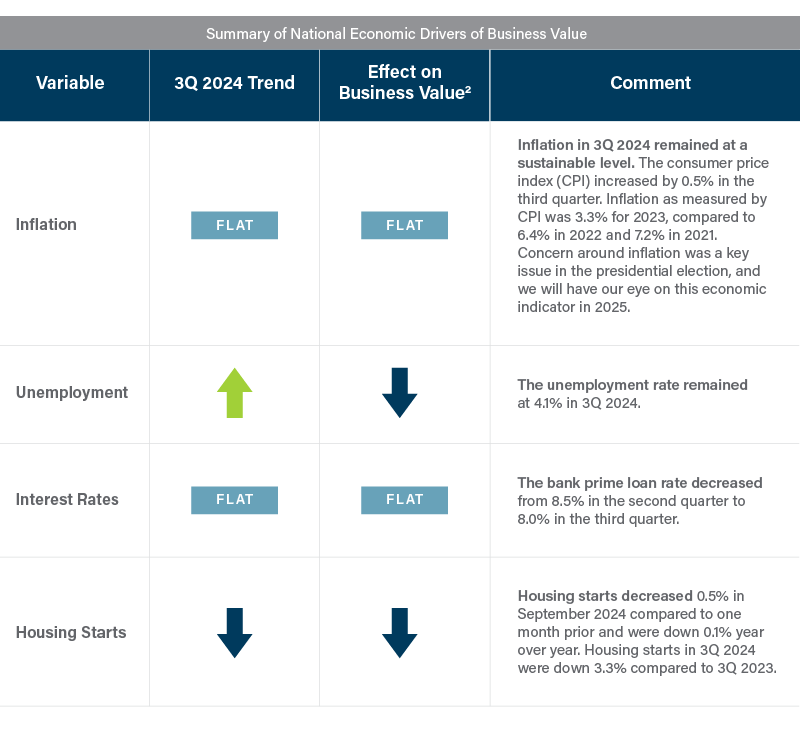
2 Indicates the likely effect on business value for most businesses. Depending on the business model, certain businesses may demonstrate an inverse relationship to economic variables compared to the market as a whole.

As many of our clients are located in New England, we’ve included a summary below of some of the key economic drivers that affect businesses in the Northeast3. If your business is headquartered outside of New England, reach out to us for an economic analysis specific to your market area.
Economic activity
Economic activity was roughly flat overall. Employment was unchanged and wages rose moderately. Prices increased only slightly, although isolated cost pressures were still noted. Retail and tourism led in terms of activity—including moderate gains in international travel—but still showed only slight growth on balance as consumers’ price sensitivity persisted or even intensified. Manufacturing revenues were down slightly amid weak demand at most firms. Demand and revenues were steady among software and IT services firms. Home sales posted modest gains from a year earlier despite an especially soft summer. Commercial real estate activity was flat but varied across property types. Sentiment for late 2024 and 2025 was cautiously optimistic on average but ranged from bullish, among tourism contacts, to pessimistic, among some manufacturers.
Labor markets
Employment was flat net of seasonal increases, and wages increased further at a moderate pace. Among IT services contacts, headcounts were stable, and wage increases ranged from slight to moderate. Summer hiring on Cape Cod in retail and hospitality was facilitated by a resurgence in short-term visas for foreign-born workers as well as increased supply of domestic seasonal workers. Hotel contacts around Boston also reported a normalization of labor supply, notwithstanding the ongoing hotel worker strike in the area. Manufacturing employment was stable overall, but one firm paused hiring and incentivized early retirement, while another increased headcount slightly. Manufacturers reported either no changes in wages or standard raises, but one firm continued to face above-average wage pressures, and another reported a large increase in healthcare costs. The outlook for hiring was subdued, as only one contact (a manufacturer) planned to expand its headcount significantly in the coming months; at the same time, no contacts intended to make layoffs.
Prices
Prices increased slightly on balance. Most manufacturers held output prices steady over the quarter, in one case despite a significant rise in healthcare costs, but one offered discounts in response to declines in input prices. Otherwise, manufacturers’ nonlabor costs (excluding healthcare) increased modestly, and one firm was concerned about increased uncertainty in shipping costs. Among IT firms, output prices increased slightly to adjust for inflation. Retail prices were stable despite slight input cost pressures. Hotel room rates in the Greater Boston area rose modestly on a year-over-year basis, though marking a step down from the pace reported in the previous quarter. Hospitality contacts on Cape Cod said that average rates for accommodations were down slightly this past summer from the previous one. Across all sectors, planned output price increases for 2025 were modest, and contacts did not express major concerns about cost pressures aside from healthcare and shipping.
Retail and tourism
First District4 retail and tourism contacts reported slight growth in revenues in recent months. Retailers on Cape Cod had a strong summer season, with activity that was roughly level with the summer of 2023. An online retailer had stable revenues overall but observed a growing gap in sales volumes between promotional periods and off-promotion periods, especially for higher-priced items. Airline passenger traffic through Boston increased moderately year-over-year, with international travel up more than 15% over 2019 levels. Hotel occupancy in greater Boston rose modestly in August from earlier in the summer, consistent with seasonal expectations and on par with August 2023. Contacts are forecasting strong tourism and convention activity for Boston for the rest of 2024 and early 2025, supported by both domestic and international visitors. Retailers expressed cautious optimism that demand would hold steady moving forward.
Manufacturing and related services
Manufacturing revenues were down slightly from the previous quarter. Most firms described demand as weak, although a frozen food producer reported strong growth in year-to-date revenues compared with the same period in 2023. For one contact, third-quarter revenues beat expectations despite declining slightly from a year earlier, while a semiconductor manufacturer said that recent results fell short of expectations because of an ongoing industrywide slump. Inventories rose modestly at selected firms, approaching higher-than-desired levels. Capital expenditures were consistent with previous plans, with one firm spending much more than last year to add a new production facility. Most firms expected stable or improving demand for the rest of 2024, but the outlook for 2025 was mixed. Half of contacts were either cautiously or unreservedly optimistic, but the other half perceived a high degree of uncertainty and feared that sales would fall short of targets.
IT and software services
Among First District IT services contacts, demand and revenues held steady on average. Concerning revenues, one firm beat expectations with a healthy increase from the previous quarter, and another saw a temporary dip that was attributed to the firm’s transition to a subscription-based model. Capital spending was flat at very low levels or declining in one case due to increased reliance on cloud-based servers. Contacts held neutral-to-positive expectations for activity at their respective businesses, based on beliefs that demand for their products and services was on the rise. Nonetheless, contacts saw risks to the overall business climate from uncertainty surrounding the presidential election, and one firm worried that inflation could surge again and hurt its profit margins.
Commercial real estate
Commercial real estate activity was stable on average, but office leasing fell short of seasonal expectations. In the Boston area, legal and financial tenants continued to provide decent office demand, but weak demand from high-tech firms persisted. The life sciences industry buoyed leasing activity in Providence, but not enough to drive meaningful changes in vacancy rates or rents. Contacts reported no recent office foreclosures, though many properties remained distressed. Industrial leasing was stable but on the slower side, especially for larger spaces, although industrial sales picked up moderately. Retail leasing was stable, and retail rents showed slight increases. Lending conditions remained tight relative to historical norms, especially for office properties, while funding was comparatively more available for industrial and multifamily properties. The outlook for the sector was mixed, with some contacts expecting no major changes in conditions and others expecting a significant increase in activity in 2025 as election-related uncertainty was resolved and interest rates fell further.
First District contacts described commercial real estate activity as flat overall. Office leasing slowed somewhat, as is typical for summer, but fell to an extremely low level in Hartford, CT. Office rents were flat, and office vacancy rates increased slightly. After having softened earlier in the year, industrial leasing was stable. Industrial vacancy rates remained extremely low, and industrial rents have reportedly stabilized at levels well above 2019 averages. The retail sector experienced steady demand, but tenants showed greater caution amid worries about consumer spending. Investment sales were flat, even though demand for non-office properties remained healthy. In general, bank lending to commercial real estate remained weak, but the CMBS market and life insurance companies continued to provide funding. However, one small regional bank expanded its (non-office) CRE portfolio modestly. Construction was flat or down slightly and still concentrated in the multifamily sector. For non-office properties, contacts expected stable, if restrained, activity going forward, reflecting elevated political and economic uncertainty. The outlook for office properties weakened further, as contacts expected a significant increase in foreclosures in the coming 12 months.
Residential real estate
First District residential home sales in August 2024 were up modestly from a year earlier but were down slightly from June net of seasonal factors. Single-family home sales increased moderately on a year-over-year basis (to August 2024) in most states but fell slightly in Massachusetts. (No data were available for Connecticut.) Contacts in Massachusetts said that summer home sales were muted, even relative to seasonal norms, as prospective buyers waited for mortgage rates to fall further; the same contacts noted that home prices softened for two consecutive months but still increased moderately from a year earlier. Home prices were also up moderately from August 2023 in the other First District states, on average, but the price changes were somewhat mixed across markets. For-sale inventories rose substantially on a year-over-year basis (to August) in every market except Massachusetts, where inventories were flat from one year earlier. Contacts were guardedly optimistic that home sales would improve further in late 2024 and into 2025, based on the likelihood that mortgage rates would fall further during that period.
3 Quoted from the Beige Book – October 2024 from the Board of Governors of the Federal Reserve System.
4 The Federal Reserve System’s First District includes Connecticut (excluding Fairfield County), Massachusetts, Maine, New Hampshire, Rhode Island, and Vermont.

Where to find us
Casey Karlsen and Seth Webber are leading a four-part workshop series for business owners about increasing business value and liquidity. We previously summarized this content in a couple of blog posts (Session 1 and Session 2). Take a look if you missed us! The next session is February 11. Register to join us here. Each session is designed to stand alone, so don’t worry if you missed the first two sessions.
Erik Olson, Seth Webber, and Casey Karlsen will be hosting a transaction advisory overview session on January 15.
Interested in meeting the team? Please reach out to us. We would love to connect.


 Skip to Main Content