Skip to Main Content

Of course, we’re all suffering from “data breach fatigue.” But some breach announcements carry considerably more risk to the victim than others. For example, if I had received a letter saying a credit card of mine had been compromised, the end result would be simple:

Financial fraud by the numbers. In a June 2016 Gallup poll, 72 percent of respondents said they had “very little” or only “some” confidence in banks.

Read this if you work at a not-for-profit (NFP) organization.

BerryDunn’s annual Not-for-Profit (NFP) Recharge event highlighted a wide array of information to support the NFP industry sector. Each year, attendees are asked to identify their top concerns for their NFP organizations. This annual survey provides insight into the real-time concerns of nearly 200 nonprofit leaders from across the country. At Recharge 2024 (you can access presentations from the event here), survey results showed a continued trend by respondents to a financial stabilization focus. 

The 2024 survey results indicated financial stability was a top concern for 69% of respondents, with employment issues listed by 51% of the respondents. This is a switch from 2023, where employment issues held the top spot. 

This continued decline in concern for employment issues (down from a high of 78% from the 2022 survey) is remarkable in the current climate of relatively low unemployment, continued turnover within the industry, and Department of Labor changes to salary exemption rules for overtime.

Overall, the top four concerns for NFP industry leaders were:

Investment in technology

Despite the additional cost of technology investment, the increasing focus on technology (48% of respondents highlighted tech as a top concern) appears to be in recognition that doing nothing in the tech space can cost more (through wasted hours, increased security risks, etc.) than investing in technology. At Recharge 2024, we highlighted some of the trends, benefits, and risks of AI in the current environment.

Organizational development

Concerns around organizational development (a concern for 40% of respondents) seem to represent increased interest in strategic planning, NFP programmatic partnerships, retirement planning, and expanded ESG opportunities. In addition to the survey results and industry update, attendees of Recharge 2024 learned more about the renewable energy tax credit, updates within the accounting sector, trends and opportunities in artificial intelligence, and a fresh look at employee benefit plan opportunities. 

The nonprofit sector continues to move forward with an eye toward long-term stability with a mission focus and a cautious growth mindset. Please contact our NFP team with questions. We’re here to help.

Recharge 2024 event resources
Nonprofit Insights podcast and other resources

Article
Top concerns for NFPs: 2024 Recharge attendee survey results

Read this if you work in finance at a renewable energy company.

The renewables industry includes some fairly unique accounting and financial reporting considerations that aren’t as common in other industries. It is important that the accounting function for these companies has an understanding of these concepts to avoid surprises when brought up by their financial auditor or a third party during due diligence. Here are a few of the more common issues we encounter when working with clients:

  • Company structure 
    The ownership structure for renewable energy projects can be somewhat complex, as they are typically modeled to direct certain tax benefits to investors. There may be issues with variable interest entities, and some structures provide percentages of ownership which may change over time or flip between investors. Because of this changing ownership, owners typically will allocate the equity of the controlling and noncontrolling interests based on the hypothetical liquidation of the project at book value (referred to as “HLBV”) at each year-end. HLBV is not a method prescribed by US GAAP and is only used if it is determined to be appropriate and consistent with the economic substance of the allocation.
  • Power purchase agreements (PPAs)
    PPAs may need to be evaluated if they contain a lease. Accounting Standards Codification (ASC) 842 Leases provides the criteria for what meets the definition of a lease. Under the Implementation Guidance and Illustrations in ASC 842, an example is provided of a contract between a power company and a solar farm where the power company agrees to purchase all the electricity produced by the solar farm; based on the fact pattern provided, the contract is determined to contain a lease. It is important to understand the circumstances and contractual provisions that lead to the determination a contract is a lease versus what leads to the determination that the contract is not a lease.
  • Asset retirement obligations (AROs) 
    Renewable energy companies that construct and operate an asset (such as a solar farm) on land that is leased from another party may have a legal obligation to restore the land to its original condition at the end of the lease. Here is more information on AROs.
  • Land leases 
    Companies may enter into land leases during the development phase of renewable projects. These agreements should be analyzed closely to determine whether they fall under ASC 842 Leases. There are a number of things to consider when looking at land leases, such as whether the lease gives the company the right to control an identified asset and whether the company has the ability to terminate the lease without incurring a significant penalty.
  • Revenue recognition for renewable energy credits (RECs)
    Revenue recognition related to the sales of self-generated renewable energy credits (RECs) can also present some accounting challenges when determining when revenue can be recognized in accordance with US GAAP. RECs generated by project assets sometimes need to go through a certification process that delays the actual sale of the REC; depending on the circumstances, including whether or not the project company has a contract to sell the RECs generated, revenue for RECs may be recognized over time (as power is generated) or at a point in time (when the RECs are actually transferred to a customer).

While this list isn’t exhaustive, it can help you find areas to focus on when preparing your financials. If you have questions about financial reporting for your company or need support for your accounting, financial reporting, or tax needs, please contact our renewable energy team. We’re here to help.

Article
Sustainable books: Financial reporting considerations for renewable energy companies

As just about any school that files a Form 990 will tell you, the Schedule B is one of the more cumbersome areas of the entire return. Schedule B requires the disclosure of every single donor (be it an individual, an entity, or a governmental unit) who contributed $5,000 or more during the organization’s tax year, including their name, address, and the amount contributed, including even more detail and description if the donation is of something other than cash. For larger educational institutions that can receive hundreds of such disclosable donations in a given year, the Schedule B reporting onus can become downright brutal. However, there is a special rule available for Schedule B reporting that could greatly reduce that requirement. Fundraising and development departments rejoice!

Unlocking the special rule for Schedule B reporting increases the threshold for reporting contributions on Schedule B from every donor of $5,000 or more to only those contributors whose contributions exceed 2% of total contribution revenue reported on Page 1 of the Form 990. In order to use the special rule, schools must be able to pass the Form 990, Schedule A, Part II Public Support test.

Schedule A, Public Charity Status and Public Support, is required to be filed by all §501(c)(3) organizations. Part I denotes the organization’s Reason for Public Charity Status. Typically, educational institutions check off box 2, which notates the entity as a school described in section 170(b)(1)(A)(ii), and simply move on without needing to complete any other portions of the Schedule. However, schools can opt to complete Schedule A, Part II in order to demonstrate that they are publicly supported, which then qualifies them to use the special rule on Schedule B. Schools do still need to check off box 2 on page 1 of Schedule A and complete Schedule E (a schedule specific to schools) as required.

Passing the Part II test on Schedule A is accomplished by demonstrating that the organization receives more than 33 1/3% of its support from contributions, grants, or membership fees. As part of the test, excess contributors are required to be tracked. An excess contributor is a contributor, other than a governmental unit or publicly supported organization, who has cumulatively over the last five years made donations greater than 2% of total cumulative support received by the organization for the same period. Beginning with the current year, the required schedule must include the name of each donor and the respective amounts contributed for the current and prior four years. This schedule should be prepared and maintained on the same basis of accounting method used by the organization for financial statement purposes. This schedule is not included as part of the Form 990 filing—it is maintained internally by the organization and is not open to public inspection.

Any excess contributions reduce total Public Support as calculated on the Part II test. Public Support is then compared to Total Support, which includes income items such as investment income and unrelated business income, among others. As long as the resulting public support percentage is greater than 33 1/3%, the organization passes the test and unlocks the Schedule B special rule.

In a very basic example, if a school has a total contribution income of $5,000,000 during the year and is able to pass the Schedule A, Part II test as prescribed above, their Schedule B donor threshold rises from every donor of $5,000 or more to just those donors whose total contributions totaled $100,000 (2% of $5,000,000) during the year. As you can see, this greatly reduces and limits the Schedule B reporting burden to potentially just a few sizeable donors.

If your organization would like to evaluate using the Schedule A Part II test to follow the special reporting rule for Schedule B, please reach out to our nonprofit tax services team. We are here and ready to help!

Article
Easy A for schools: Pass the test to reduce requirements under Schedule B

The Federal Deposit Insurance Corporation (FDIC) recently issued its first quarter 2024 Quarterly Banking Profile. The report provides financial information based on call reports filed by 4,568 FDIC-insured commercial banks and savings institutions. The report also contains a section specific to community bank performance. In the first quarter of 2024, this section included the financial information of 4,128 FDIC-insured community banks. BerryDunn’s key takeaways from the report are as follows:

The first quarter of 2024 resulted in community banks’ quarterly net income increasing $363.2 million from the previous quarter. 

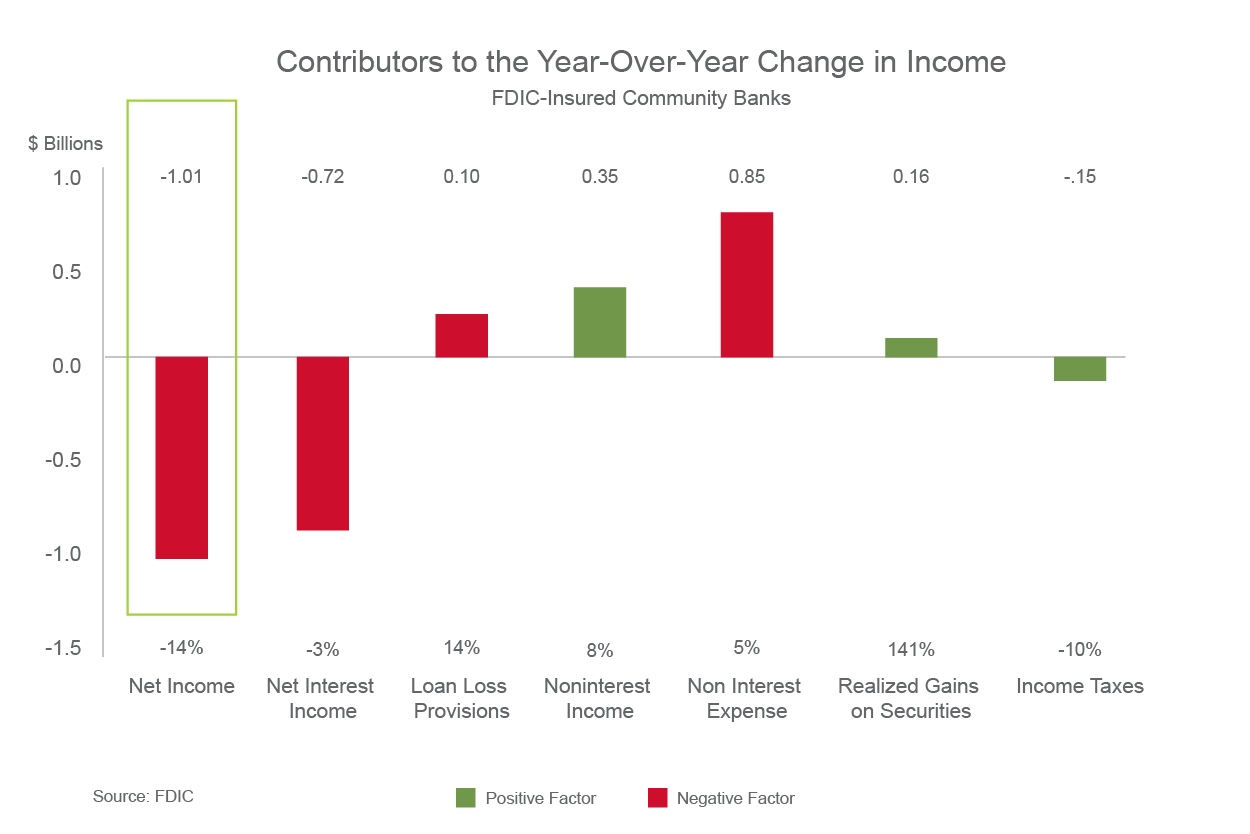
Quarterly net income for community banks increased 6.1% in first quarter 2024, resulting in $6.3 billion of quarterly net income. Despite the increase in quarterly net income, full year net income declined. Compared to first quarter 2023, net income had decreased $1 billion or 13.9%. Half (49.9%) of all community banks reported a decline in net income compared to fourth quarter 2023. Net income for community banks was impacted by higher noninterest expense and lower net interest income.

Despite remaining consistent in the prior quarter-over-quarter comparison, NIM (net interest margin) resumes the declining trend into 2024.


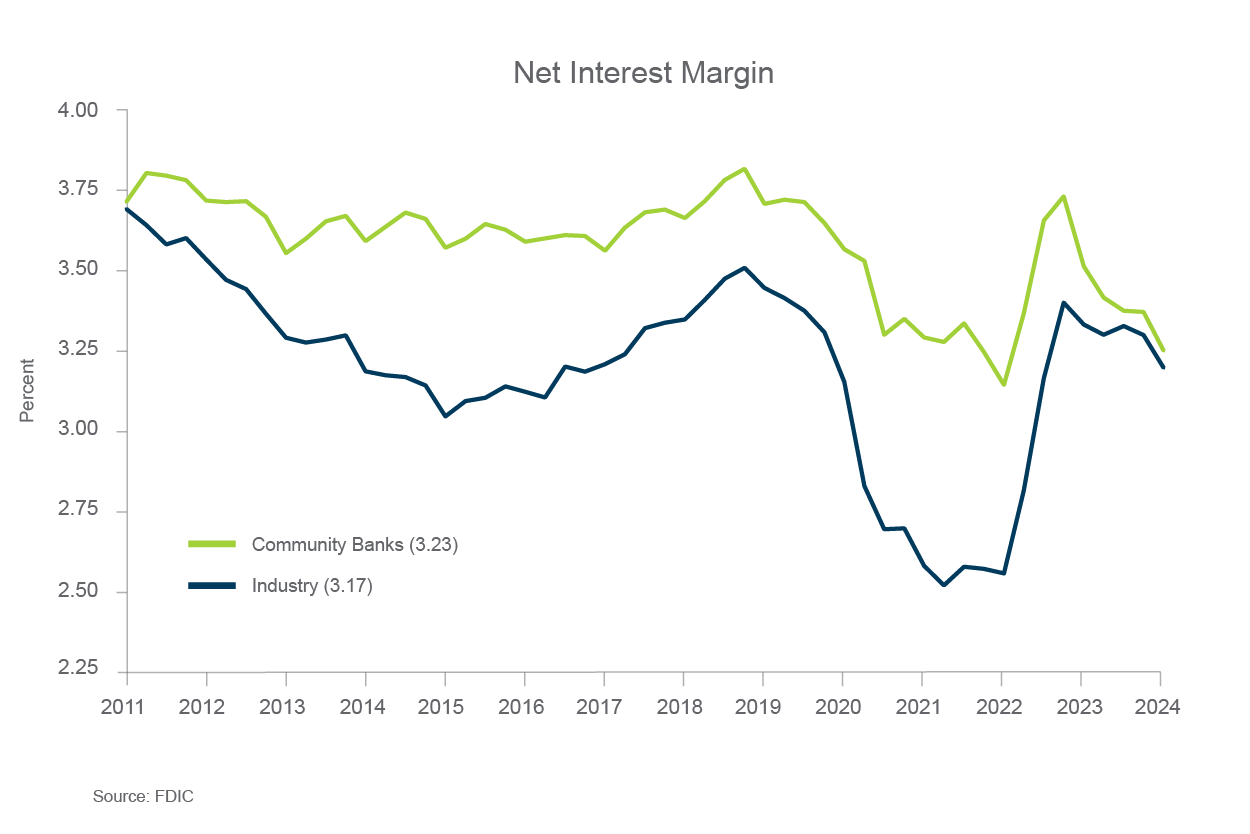
Community banks’ NIM dropped in the first quarter to 3.23%. NIM was down 26 basis points from the year-ago quarter. The yield on earning assets increased 66 basis points, and the cost of funds increased 92 basis points. Despite the significant decline, the community banks’ NIM performance continued to prevail the overall banking industry’s NIM of 3.17%, which declined 10 basis points in first quarter 2024. The banking industry’s NIM dropped seven basis points below the pre-pandemic average NIM of 3.25% for the first time since third quarter 2022.

Loan and lease balances continued to grow in first quarter 2024, with 62.9% of community banks reporting quarterly loan growth. 

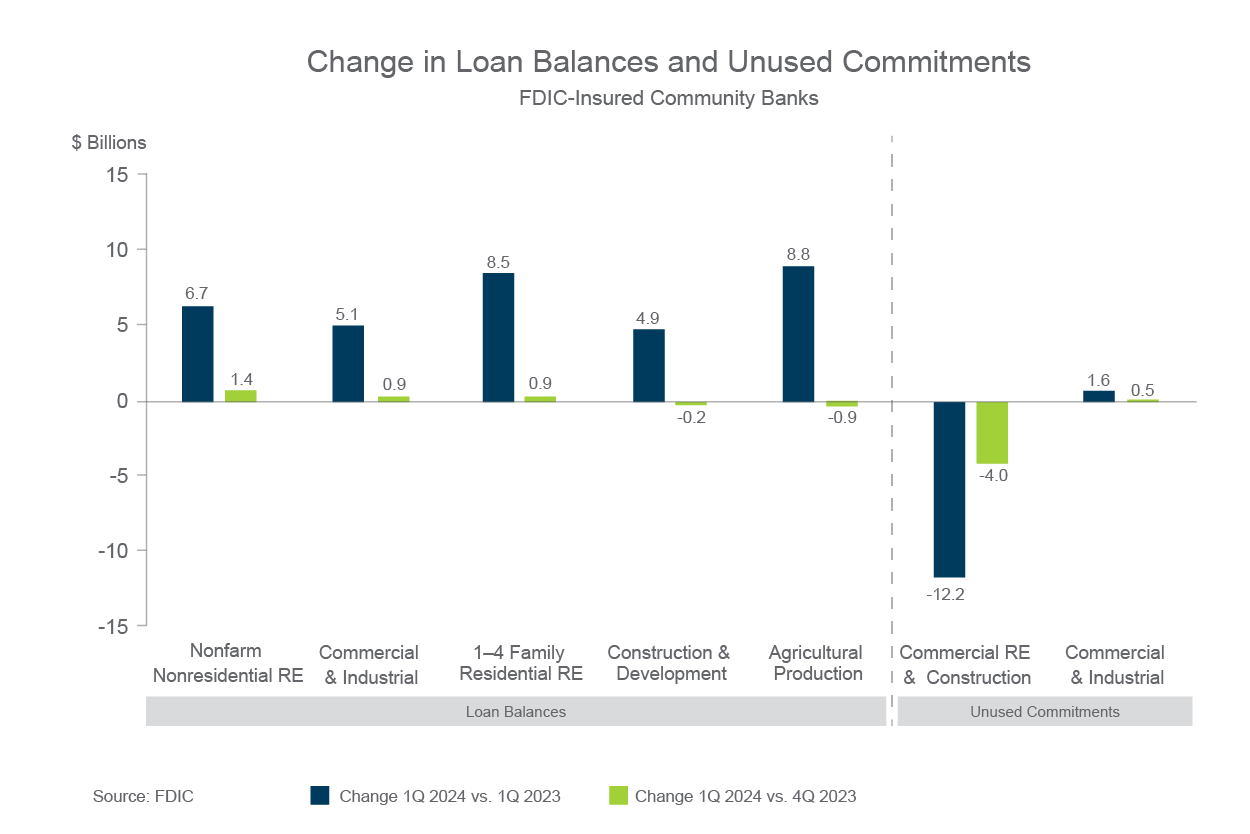
Loan and lease balances continued to see widespread growth in first quarter 2024. Community banks saw loan growth in all major portfolios except construction and development loans and agricultural production loans. Nonfarm, nonresidential commercial real estate (CRE) loans exhibited the most growth from fourth quarter at 1.4%, followed closely by residential real estate and C&I loans, both at 0.9%. Total loans and leases grew 7.1% from one year ago. This year-over-year growth was also driven by farm, residential real estate and nonfarm, nonresidential CRE loans, which showed growth year-over-year of 8.8%, 8.5%, and 6.7%, respectively.

More than half of all community banks (61.9%) reported an increase in deposit balances from the previous quarter. 


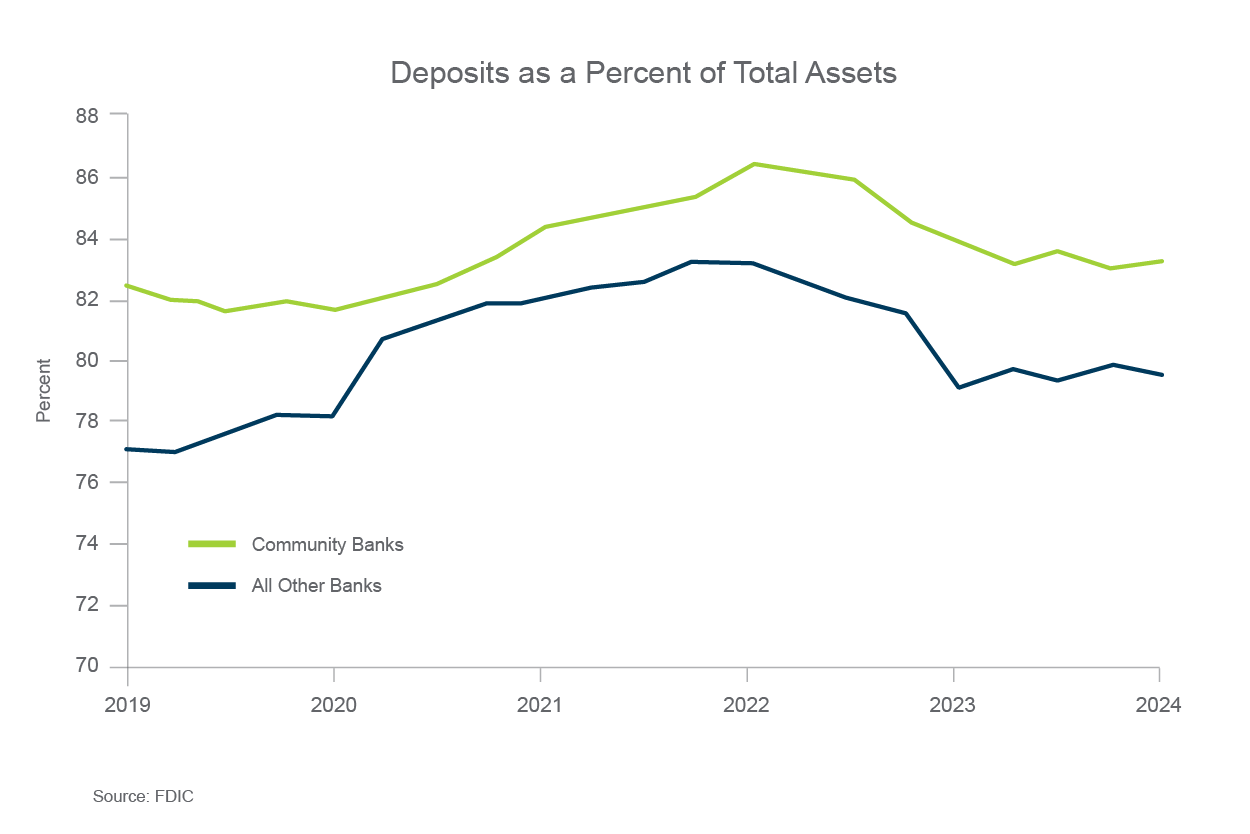
First quarter 2024 showed growth in interest-bearing deposits of $35.6 billion but a decline in noninterest-bearing deposits of $12.9 billion from the previous quarter. Total assets at community banks increased 0.8% quarter-over-quarter and 4.0% year-over-year. Community banks’ total deposits as a percentage of total assets have been declining since reaching 86.71% in first quarter 2022; however, community banks have yet to return to the low of 81.75% shown in first quarter 2020. The average total deposits as a percentage of total assets has shown year-over-year increases of 0.41%, 2.57%, and 0.95% from 2019 through 2022, respectively; however, the community banks have shown a year-over-year decrease in average total deposits as a percentage of total assets of 2.44% and 0.15% into 2023 and the first quarter of 2024, respectively.

BerryDunn and Stifel recently held the 11th annual New England Banking Summit on May 30th in Portsmouth, New Hampshire. The firms were joined by over 30 different organizations and touched on current economic trends, accounting standards and tax updates, strategies for maximizing benefits and minimizing risks within financial institutions, navigating change, and ways to optimize Current Expected Credit Losses (CECL) processes. Chief Economist Lindsey Piegza, Ph.D. from Stifel, spoke, amongst other things, about the May Federal Open Market Committee (FOMC) meeting. She noted she believes the FOMC will remain on the sidelines for longer than previously expected. The FOMC stated that “readings on inflation have come in above expectations.” This could continue to put downward pressure on NIMs more so than already seen in the above graph.

The inactivity by the FOMC has also wreaked havoc on some bank’s budgets, especially those that optimistically budgeted some rate cuts in 2024. But this projected inaction should not be reason to declare defeat. Bankers are great at pivoting, which was proven continuously during the pandemic. This is another opportunity for banks to pivot and change strategic direction. For instance, this may be a time to focus on other, non-interest revenue sources, or possibly revisit recurring operating costs for opportunities to streamline.

As always, BerryDunn’s Financial Services team will be right alongside you, navigating every rise, bump, and drop of this rollercoaster ride together.

Article
FDIC Issues its First Quarter 2024 Quarterly Banking Profile

Read this if you are preparing for a retirement plan audit.

Few things can feel as daunting as preparing for an audit, especially if it’s your first time being audited. With all the information circulating about new laws and regulations dictating who is required to undergo an audit, compliance issues can become even more complicated. Here are some considerations to help you as you prepare for a retirement plan audit.

While it might seem obvious, it’s worth noting that the purpose of an employee benefit plan is to generate and protect retirement income on behalf of your employees. Plan transactions should be processed in accordance with plan provisions so that employees receive the maximum retirement benefits they have earned. This is why laws and regulations exist and, in some cases, audits are required. 

Fiduciary responsibility

Those who hold authority over employee benefit plan operations and assets—such as plan administrators—have a fiduciary responsibility to oversee and protect the plan, acting in the best interests of the plan’s participants and their beneficiaries. Fiduciaries can be held personally liable if this responsibility is not upheld. Yet this is only one of the many complexities that comes along with maintaining an employee benefit plan. Additional complexities to consider include diversifying plan investments and selecting and monitoring service providers.

Even if your employee benefit plan does not meet the participant threshold that requires an annual audit, your plan is still subject to the same laws and regulations as plans requiring an audit. One of the most important things you can do as a fiduciary, or as someone involved in the operations of an employee benefit plan, is to stay current on changing laws and regulations. 

It is also important to understand your plan’s adoption agreement, including its nuances, which vary from plan to plan. These nuances can include, but are not limited to, navigating the intricacies of vesting provisions, participant loans, distribution types, and defining what constitutes plan-eligible compensation.

Independent auditors

Plan sponsors can also benefit from working with an independent auditor, even when it is not legally required. Many service providers offer consulting services, typically referred to as audit-readiness assessment services, at a lower cost than an audit and with similar benefits, including an understanding of any gaps in internal controls, a deeper understanding of accounting standards and compliance requirements, and an opportunity to improve documentation and processes to maintain operational compliance with plan documents and regulatory guidance. These services are vast and customizable and can help you maintain compliance with ERISA and IRS regulations, work efficiently with third-party administrators, and test operational workflows to identify processes that should be occurring throughout the plan year. 

As retirement plan auditors, a common challenge we see when conducting first-time plan audits is the amount of time it takes the employer to remit employee contributions to the plan and how quickly those funds are invested in the employee’s retirement account. Optimally, this transaction should align with the same date the employee funds are withheld during the payroll process. This is an area that would be examined by an auditor in an audit-readiness assessment and is one example of the many ways this type of service can support improvements to your plan operations and compliance.

Other things to be aware of include the timeline for processing electronic deferral election changes in the plan sponsor payroll software, calculation of participant vesting and identification of forfeited amounts, and making sure all calculations for contributions are based on the correct definition of plan compensation per your plan documents.

Audit-readiness assessments

Is your plan a candidate for an audit-readiness assessment? While not suitable for everyone, investing in an audit-readiness assessment service is certainly worth considering. This is especially true if your plan is growing, you are seeking to become better prepared should that audit come, or you are simply feeling overwhelmed. Whatever the case, if you would like to discuss your options, the BerryDunn Employee Benefit Plan Audit team is here to help. 

Article
Considerations for preparing for your first retirement plan audit